Attention
This document is no longer being updated. For the most recent documentation, including the latest release notes for version 6, please refer to Documentation Version 7
Data Viewer
A big advantage of the Datavault Builder is the possibility to directly access the data within the development environment. Besides the Data Viewer, the Data Preview as well lets you have a quick look at the data. The advantage of the Data Viewer is being able to do some more data profilling, by selecting specific columns, using visualizations and aggregates.
- There are two main use cases:
Access a staging table to find a business key.
Access the log tables for debugging your data integration flow.
General Usage
When navigating to the Data Viewer, the working area is empty, so you first have to click into the search-bar to select a table/view to analyze. Once you have picked a table from the list, the visual data profiler opens up on the working canvas.
Note
To not overload the webinterface, the resultset will be limited to 600 records. Make use of the database-side aggregation to reduce the result set.

- Search-Bar
By clicking into the box, a table/view for analysis can be chosen.
- Available Columns
After picking a source for analysis, the available columns will appear on the left hand side in the panel.
- Chosen Columns (row)
By dragging a column from the available columns into the area of the chosen columns (row), the data profiler will load the corresponding values with the specified aggregator. The chosen columns can be rearranged in order, as the results are grouped together according to the order specified (according to the chosen visualization).

By double-clicking onto a column-field, the filter-selection appears. This allows you to filter the loaded data by certain values. The filtering is only available for chosen columns and will display “null” as values when double-clicking onto a column field in the available columns section.
- Chosen Columns (column)
Columns can as well be drag & dropped into the chosen columns (column) area. Use this to build pivot-based analytics.
- Visualization Control

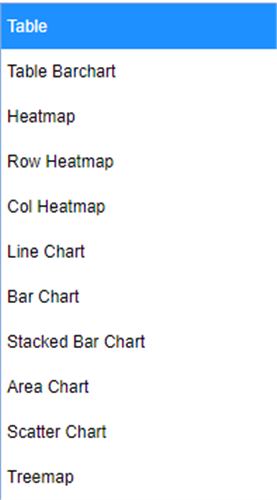
The dropdown allows you to pick a certain kind of visualization of the data. The default is “Heatmap”, as this will give you an indication to find the business key.
- Aggregation Control
 The aggregation gives you the possibility to influence the totals fields for each row. Depending on the chosen aggregator, a second field will appear to further define the wished for aggregation (for instance “Count unique” will allow you to pick a specific column to count the uniqueness of).The aggregation is done on the database, only returning the result. This may take some time depending on the size of dataset.
- Refresh
The Datavault Builder will always auto-reload new data, when adding a field to the selection. Sometimes, when having already selected specific columns, visualization and aggregator, it can be useful to manually trigger the refresh of the data.
Finding the business key
An important step when developing an integration flow within Data Vault modeling is to define the business key, which should be loaded into a hub. This business key has to be unique, as it identifies the object. The Data Viewer with its default visualization “Heatmap” will support you to find a unique business key. An even faster way to check, if your composed key is unique can be done by using the uniqueness check while creating a new hub load.
- Steps
Select the newly staged table from with the search-bar.
Drag & drop a column (-combination) from the available columns to the chosen columns (row)-section.
The visualization will now give a visual feedback, whether the chosen combination of columns results in a unique identification, by highlighting duplicates in red.

Example of a column selection with duplicates highlighted in red.
Note
The uniqueness-check is only an indication and does not run over the whole data-set. A full check will be done when loading a hub in the Data Vault core. Then the system will automatically throw an error if the key violates the uniqueness constraint.
Using the log
The Datavault Builder has multiple logs, documenting the actions. The logs can be directly accessed on the database (Schema: dvb_log) or through the Data Viewer.
- Steps
Navigate to the Data Viewer.
Type “System” into the search-bar.
Select one of the logs appearing in the dropdown.
- Available Logs
Staging Load Log: Documents every load from a source into the staging area.
Datavault Load Log: Documents every load from a staging table into a data vault object.
Job Load Log: Documents every load initiatet as job load.
DV Creation Log: Documents every action based on the invoked function in the core module.
DV Builder Log: Documents every query executed against the processing database.
Note
The resultset returned to the Data Viewer is limited to 600 records. In case of the logs, the latest 600 records in the log will be returned.